20 most important KPIs for sales teams to track

Sales KPIs are the most important metrics for your team. Done right, they can provide valuable insights to optimise your sales process.
You can’t improve what you don’t measure, but choosing the right metrics for your goals can be challenging.
In this article, we cover 20 valuable KPIs for sales teams to track so you can determine which ones are right for you.
What are KPIs for sales?
Sales KPIs (key performance indicators) are measures that sales teams use to track progress toward objectives and broader business goals. They help you assess the effectiveness of your sales strategy so you can determine whether your sales activities are working or if you need to rethink your approach.
Choosing the right sales KPIs
For the most accurate tracking, set specific goals and sales objectives and align your KPIs with them. A company with a goal like “sell as much as you can” will struggle to measure whether the team – and each rep – is achieving it.
Likewise, a sales manager only tracking “deals closed” will miss where the team is struggling if not also tracking activities, such as “proposals sent” and “demos held”.
Each company will have its own unique goals. Two companies may offer the same product, but one may focus on expanding its territories while the other aims to acquire more local customers.
Sales goals often fall into two categories:
- Activity goals. Goals based on your team’s actions, like increasing initial calls for a specific buyer persona.
- Performance-based goals. Goals based on results, like increasing annual sales revenue by 25%.
Once you’ve chosen your sales goals, make them even more effective and eliminate guesswork by creating a SMART goal (one that’s specific, measurable, achievable, relevant and time-bound).
The sales objective is the planned action to achieve that goal and KPIs are what you’ll measure to track progress.
As mentioned above, the right objectives for your team will depend on your sales and broader business goals. They’ll also depend on your team’s performance.
For example, setting ambitious revenue goals doesn’t make sense if your team can’t achieve them. Figure out which short-term changes will impact your long-term success.
It’s also important to note that your sales objectives will vary depending on factors like industry, location and company size.
20 sales KPIs for sales teams
While goals and objectives will be unique to each company, several effective KPIs can measure team performance toward objectives.
Here are 20 KPIs for sales managers to consider:
- Monthly sales growth
Monthly sales growth helps sales leaders uncover problems quickly and remedy them. Setting monthly sales growth targets also motivates sales team members to perform well, giving them goals to work toward in four-week sprints.
Monthly sales growth = ((Sales for the current month − sales for the previous month) ÷ sales for the prior month) × 100
2. Average profit margin
Average profit margin focuses only on profits from sales revenue. It tells you whether sales efforts are contributing to company revenue and whether those efforts are sustainable.
Average profit margin = (Net income ÷ net sales) × 100
3. Average purchase value
Average purchase value is the average dollar amount customers spend on your products or services. It’s an ideal metric for companies focused on boosting revenue from current customers.
Average purchase value = Total sales ÷ number of customers or transactions
4. Customer acquisition cost (CAC)
Customer acquisition cost is how much it costs to gain a new customer, including all sales and marketing expenses, salaries and overhead costs. It helps companies set budgets to make sure acquiring new customers remains sustainable.
CAC = Total sales and marketing costs ÷ net new customers
5. Average customer lifetime value (CLV or CLTV)
Average customer lifetime value estimates how much revenue a company gains per account across the customer lifespan (how long they’re typically with the company).
Average CLV = Average customer value × average customer lifespan
6. Customer retention rate and churn rate
Customer retention rate is the percentage of customers who continue buying your product or service. It measures your sales team’s ability to nurture loyal customers and support recurring sales. Churn rates reflect the percentage of customers who don’t renew or buy again. This metric can signal problems with your product or offer; it can also indicate competition.
Churn rate = (Number of customers lost ÷ starting number of customers) × 100
Retention rate = 1 ÷ churn rate
7. Monthly sales bookings
The sales bookings KPI calculates the value of a won sale minus costs over a specific timeframe.
Monthly sales bookings = Total value of new bookings for the month − (average cost per transaction × total number of bookings)
8. Calls or emails per sales rep
If you’re measuring the performance of individual salespeople, cold calls or emails per day or month can help you track productivity.
9. Sales per rep
This performance-based KPI for sales reps helps managers set sales targets by telling you how many sales reps sell on average over a given period, so you know whether you are setting realistic targets. It’s important to note that reps and situations vary, so be sure to account for this when tracking this metric, this is
an important metric for measuring growth and comparing sales across periods
Sales per rep = Total sales over the period ÷ number of reps
10. Monthly demo calls
Keeping track of monthly sales demo calls helps companies predict how many customers will buy.
Customers in the demo stage are more likely to convert than customers in the early stages of a sales cycle. Knowing how many are meeting to learn about your product and then converting tells you how well this is happening in future periods.
Track monthly demo calls inside a customer relationship management (CRM) system. It supports sales funnel assessment and helps reps convert leads into customers!
11. Lead conversion rate
Focusing on sales-qualified leads helps determine your sales team’s win rate. You can also calculate it broadly to measure sales effectiveness and ensure marketing teams work together to convert leads.
Lead conversion rate = (Total number of sales ÷ total number of leads) × 100
12. Sales opportunities
Sales opportunities estimate the value of a lead based on the odds of closing the sale.
Sales opportunity = Value of sale × opportunity status
13. Sales target attainment
Sales target attainment allows you to track sales team performance compared to previous periods or against prior targets.
Sales target attainment = (Sales for the current period ÷ sales target) × 100
14. Quote-to-close ratio
The quote-to-close ratio compares the number of closed deals to quotes sent out. You can use it to assess the effectiveness of your sales reps by comparing it to historical trends or current targets.
Quote-to-close ratio = (Number of closed and won deals ÷ number of quotes) × 100
15. Monthly recurring revenue (MRR) and annual recurring revenue (ARR)
MRR tells companies what they can expect to make per month from recurring revenue (i.e., subscriptions). ARR calculates the recurring income generated from longer-term subscriptions or contract accounts, such as companies with two-year deals.
MRR = Total number of paying customers in the month × average revenue per customer that month
ARR = (Total revenue from annual subscriptions) + (Any additional ongoing revenue) − (Cancellations)
16. Average revenue per account
Average revenue per account is important when creating marketing campaigns that speak to high-value audiences and use an account-based approach to selling.
Average revenue per account = MRR ÷ total number of accounts
17. Sales volume by location
Tracking sales volume by location reveals where the most significant demand for your products is and sets the stage for changing your sales strategy.
Sales volume by location = (Number of sales in target location ÷ total number of sales) × 100
18. Upsell and cross-sell rates
Effective upselling and cross-selling tactics are key to increasing revenue, as it is often easier to convince customers who already trust your business to buy.
Upsell rate % = Upsell revenue ÷ total revenue
Cross-sell rate % = Cross-selling revenue ÷ total revenue
19. Average sales cycle length
Understanding the average length of your team’s sales cycle can help you optimise sales processes online and offline. You can use it to compare how long each rep takes to close deals and how that impacts close rates and customer retention.
Average sales cycle = Length of all deals by the day ÷ total number of deals
20. Average response time
Average response time is a measurement of the average amount of time it takes your sales reps to respond to new leads who filled out a form or perform outreach to qualified leads.
Average response time = Total amount of time to respond to tickets ÷ total number of tickets
KPI benchmarks for sales teams
Your team’s benchmarks will depend on your industry and current performance.
Many sales teams, however, will start by measuring current performance against previous benchmarks.
Tracking sales KPIs using Pipedrive’s CRM sales dashboard
Pipedrive is a CRM that helps you manage your sales pipeline, monitor leads and automate your sales process.
Pipedrive’s dashboards provide real-time insights into which sales activities drive the most sales. They can also help you identify which sales reps are meeting their targets so you can reward them for their hard work.
You can set goals and create
sales reports in the Pipedrive KPI dashboard to track benchmarks like win rate, number of deals in the pipeline and sales activities.
Creating Pipedrive KPI reports
Pipedrive reports provide insights into the performance of your pipeline, deals, leads and sales reps. You can also use the Insights feature to forecast projected revenue based on the deals in your pipeline.
Tracking KPIs by setting goals in Pipedrive
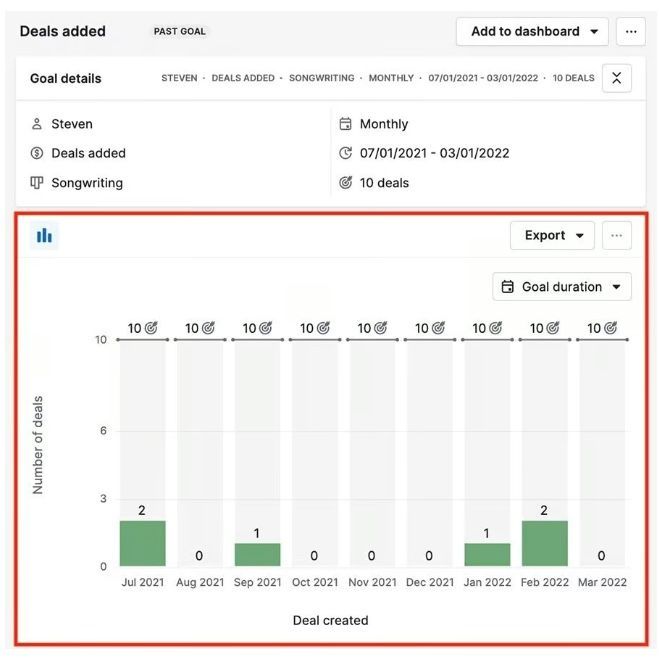
To track your KPIs within Pipedrive, start by setting goals so you can monitor your progress and forecast projected revenue.
Alternatively, you can set individual reps with goals to keep them on track, as shown in the image below.
Stay Connected with ERBS
Read our latest updates
Enquire now
Get in touch