SageCRM insights - Management Dashboards
Nick Rainbird • May 11, 2020
Welcome to this weeks SageCRM-Insights article where we will be looking at the Interactive Management Dashboards that come ready to use with SageCRM, these include the Sales KPIs for Managers
and Sales Metrics for Managers
templates.
What is the interactive dashboard?
The
interactive dashboard
is a highly-customisable workspace where you control what information you need to see to be effective in your job. You can create multiple dashboards and gadgets by choosing the data source from SageCRM reports, searches, groups, notifications, workflows the web or ERP systems using SData. You can also define the actions you want to drive from your workspace such as opening the report results, navigating directly to a entity summary screen or a new or workflow action screen. Watch one gadget change as you scroll through another using record summary gadgets and drag and drop your gadgets to create the layout you want.
What is shown on the Management Dashboards?
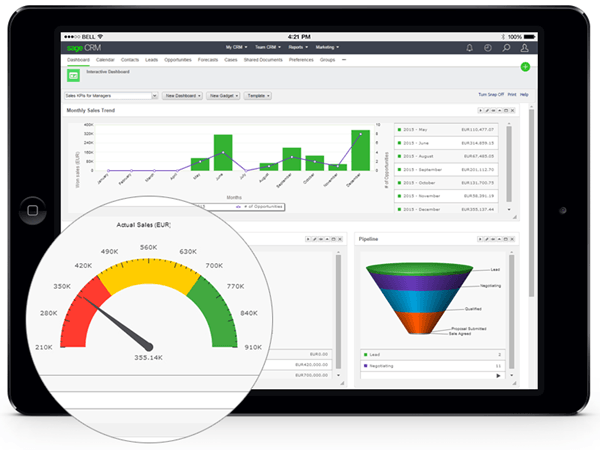
First up is the Sales KPIs for Managers dashboard which displays key performance indicators (KPIs) to help you identify and measure your organisation's successful activities as well as those that are not performing so well. Metrics include monthly sales trends, actual vs. target, opportunities pipeline, open activities, at-risk opportunities, and closed deals leader board by sales rep.
The
Sales KPIs for Managers dashboard includes the following gadgets with explanations:
- Monthly Sales Trends. Compares the value of sales won this year with the value of sales won last year. It also shows the number of opportunities that were won this year.
- Actual vs Target. Shows the opportunity revenue that’s been won as a percentage of forecasted sales.
- Pipeline. Shows information about all currently open opportunities grouped by stage.
- Open Activities. Displays information about calendar entries for a specific period such as demos, letters to be sent, and meetings.
- At Risk Customers. Shows customers and leads who haven't been contacted in over 90 days, or customers and leads in a company that's greater than 90 days old who've never been contacted. These customers are considered at risk of leaving your company.
- Won Deals Leaderboard. Displays the number of opportunities that each sales rep has won.
The Sales Metrics for Managers dashboard helps you measure progress toward organisational goals. Metrics include leads generated by source, deals lost to competitors, won vs. lost deals, average deal close rate, cross-sell deals, and top open deals.
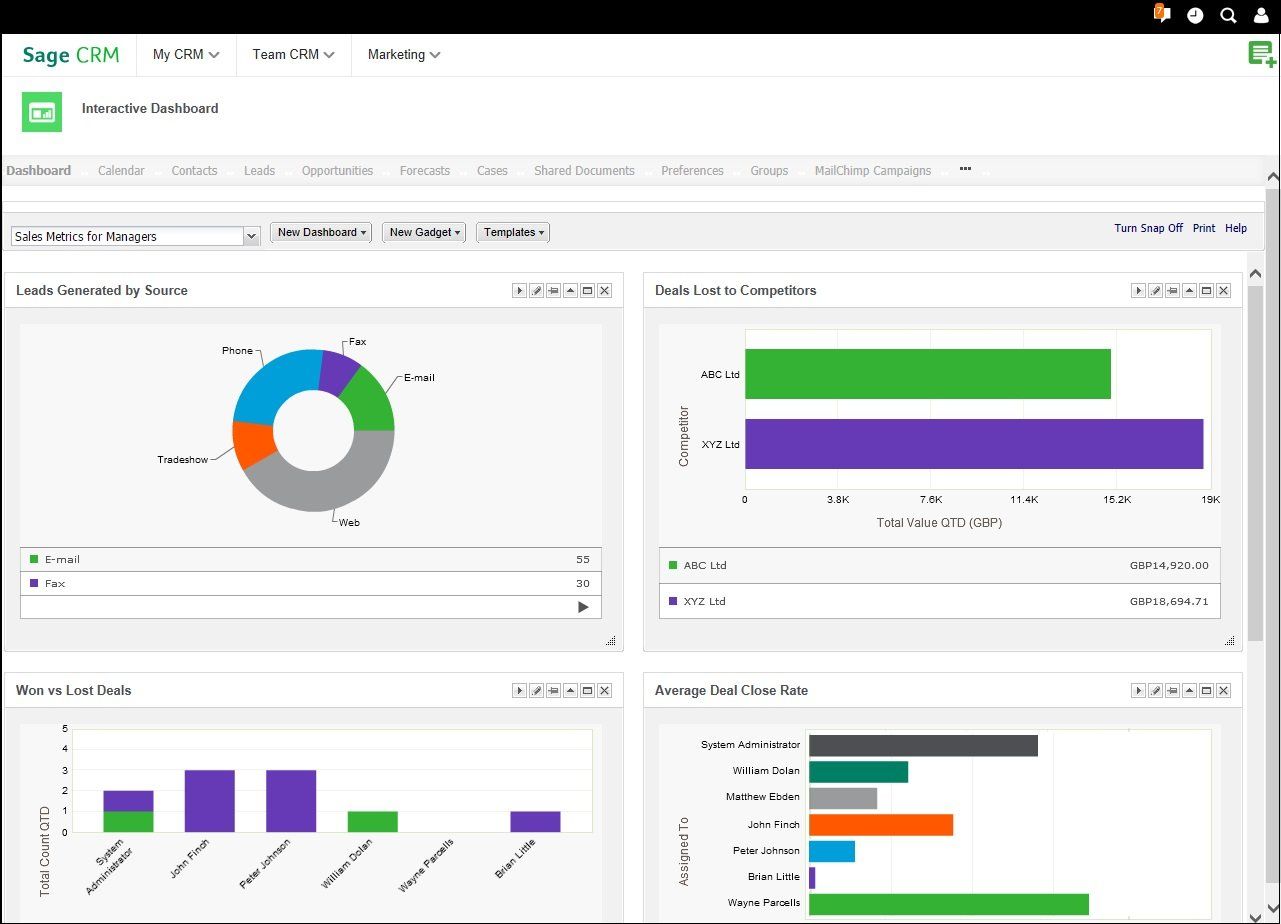
- Leads Generated by Source. Shows the number of leads in your system according to how they were sourced.
- Deals Lost to Competitors. Displays deals that your organisation was bidding on but lost to a competitor. The report is based on the Competitor, Winner, and Reason for Loss fields in each opportunity record.
- Won vs Lost Deals. Shows opportunities that each sales rep has won and lost in a specified period of time.
- Average Deal Close Rate. Displays the amount of time between a new opportunity being created and closed. The information is grouped by sales rep.
- Cross-sell Deals. Shows the number of cross-sell opportunities created during a specific time period by each sales rep. A cross-sell opportunity is one that's created when another opportunity closes. For example, if you sell a computer, a cross-sell opportunity could be to sell a maintenance plan for the computer.
- Top Open Deals. Displays the number of current opportunities that are in progress and greater than a specified value. The information is grouped by company.
If you are not already using the management dashboards in SageCRM I would recommend setting up access so you can see these in action against your organisations data and provide you valuable insights. If you need help accessing or sharing the dashboards or you are interested in creating additional dashboard s then please feel free to get in touch on 01494 490409
or email the support team on support@rainbirdbusiness-solutions.com where we can assist you with this.
Until the next SageCRM Insights instalment keep safe and we will continue to help you unlock your success with SageCRM!
Nick
Rainbird Business Solutions
Stay Connected with ERBS
Read our latest updates
Enquire now
Get in touch
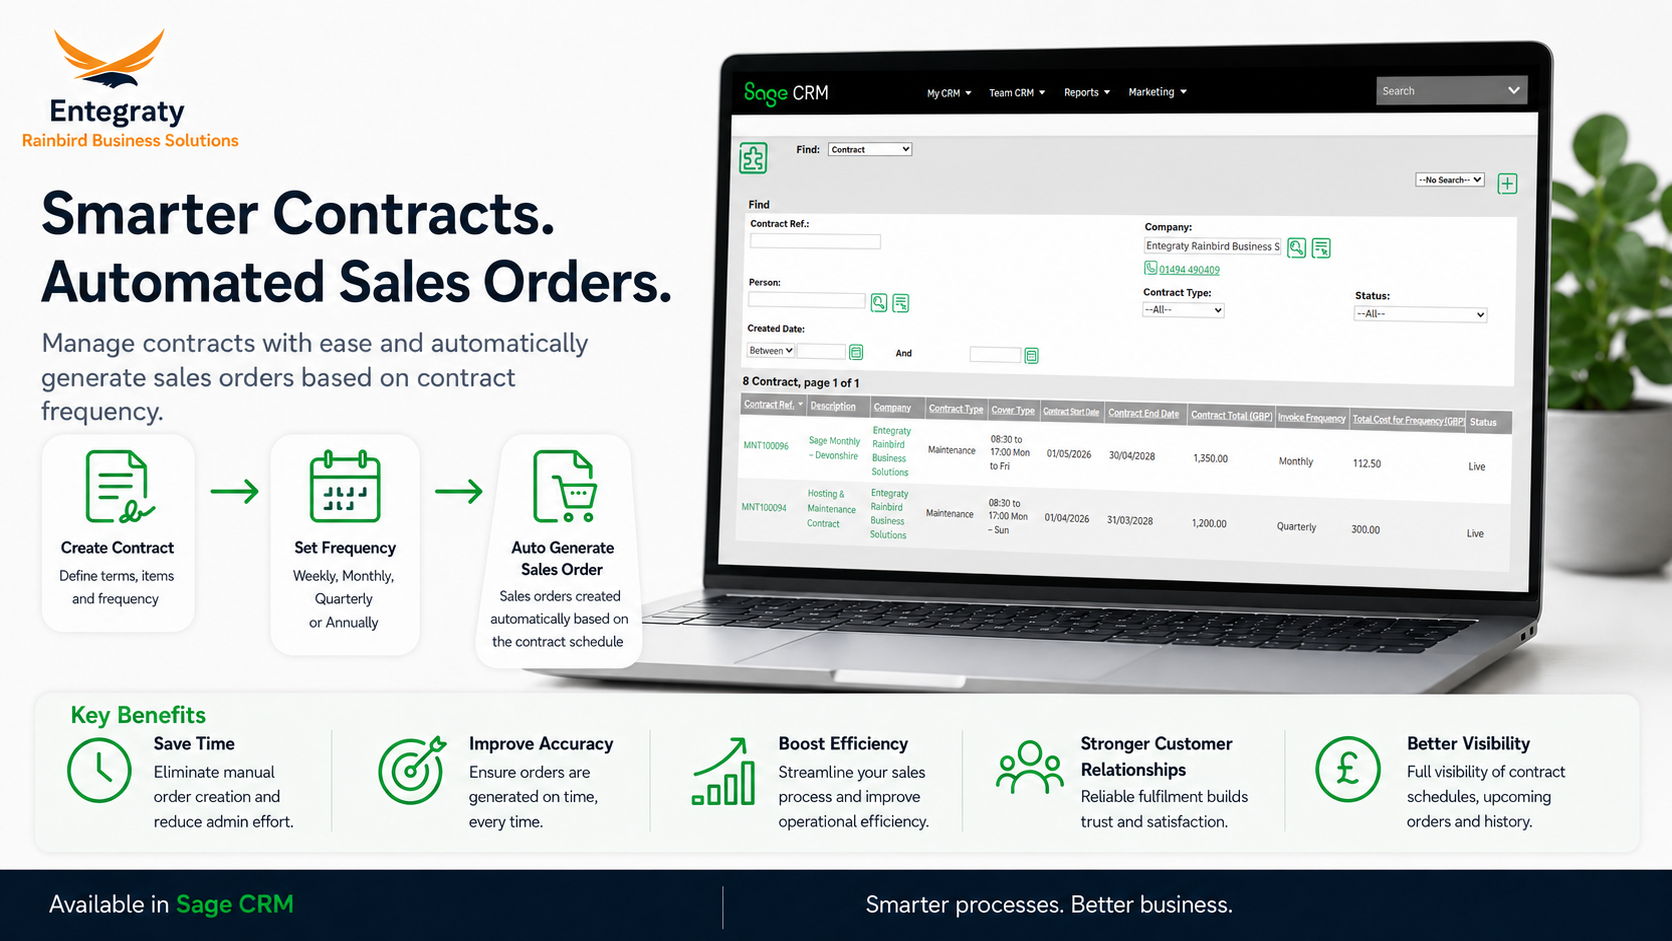
ERBS's Contracts module for SageCRM allows businesses to easily create and manage contracts, renewals and automatically generate sales orders based on the contract billing frequency, helping teams streamline operations, reduce manual effort, and improve billing accuracy. Fully integrated with Sage50 and Sage200 the auto generated sales orders can then be posted from SageCRM directly at a click of a button. Key Features: Contracts can be created directly from sales quotations or orders Supports multiple and custom billing frequencies (4 weekly, monthly, quarterly, annually) Contract and Product level Site management Process contract amendments midterm tracking historic changes and authorisations if required Easy Management of Annual Price Increases at product level Renewal and purchase order reminders and dashboards On Hold and Cancellation processes By connecting contracts directly to automated sales order generation, businesses can create a more reliable and scalable process for recurring business that help teams work smarter, improve visibility, and accelerate growth If you would like to find out more about the Contracts module for SageCRM please feel free to get in touch on 01494 490409 or email me at nick@rainbirdbusiness-solutions.com to discuss these further.
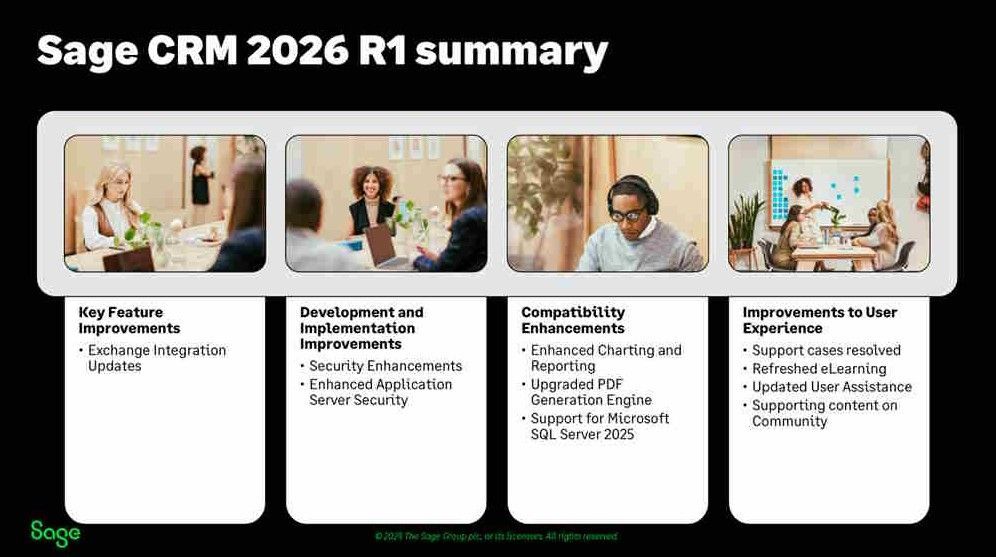
SageCRM 2026 R1 is positioned as a Security and Compatibility release, focused on reinforcing the platform’s resilience, reliability, future readiness and long-term sustainability.
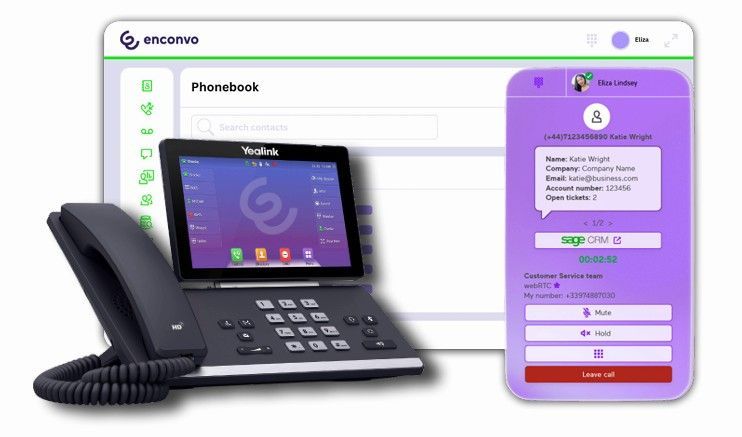
Learn how integrating SageCRM with your telephony system increases sales efficiency, improves customer engagement, and accelerates deal closures.